


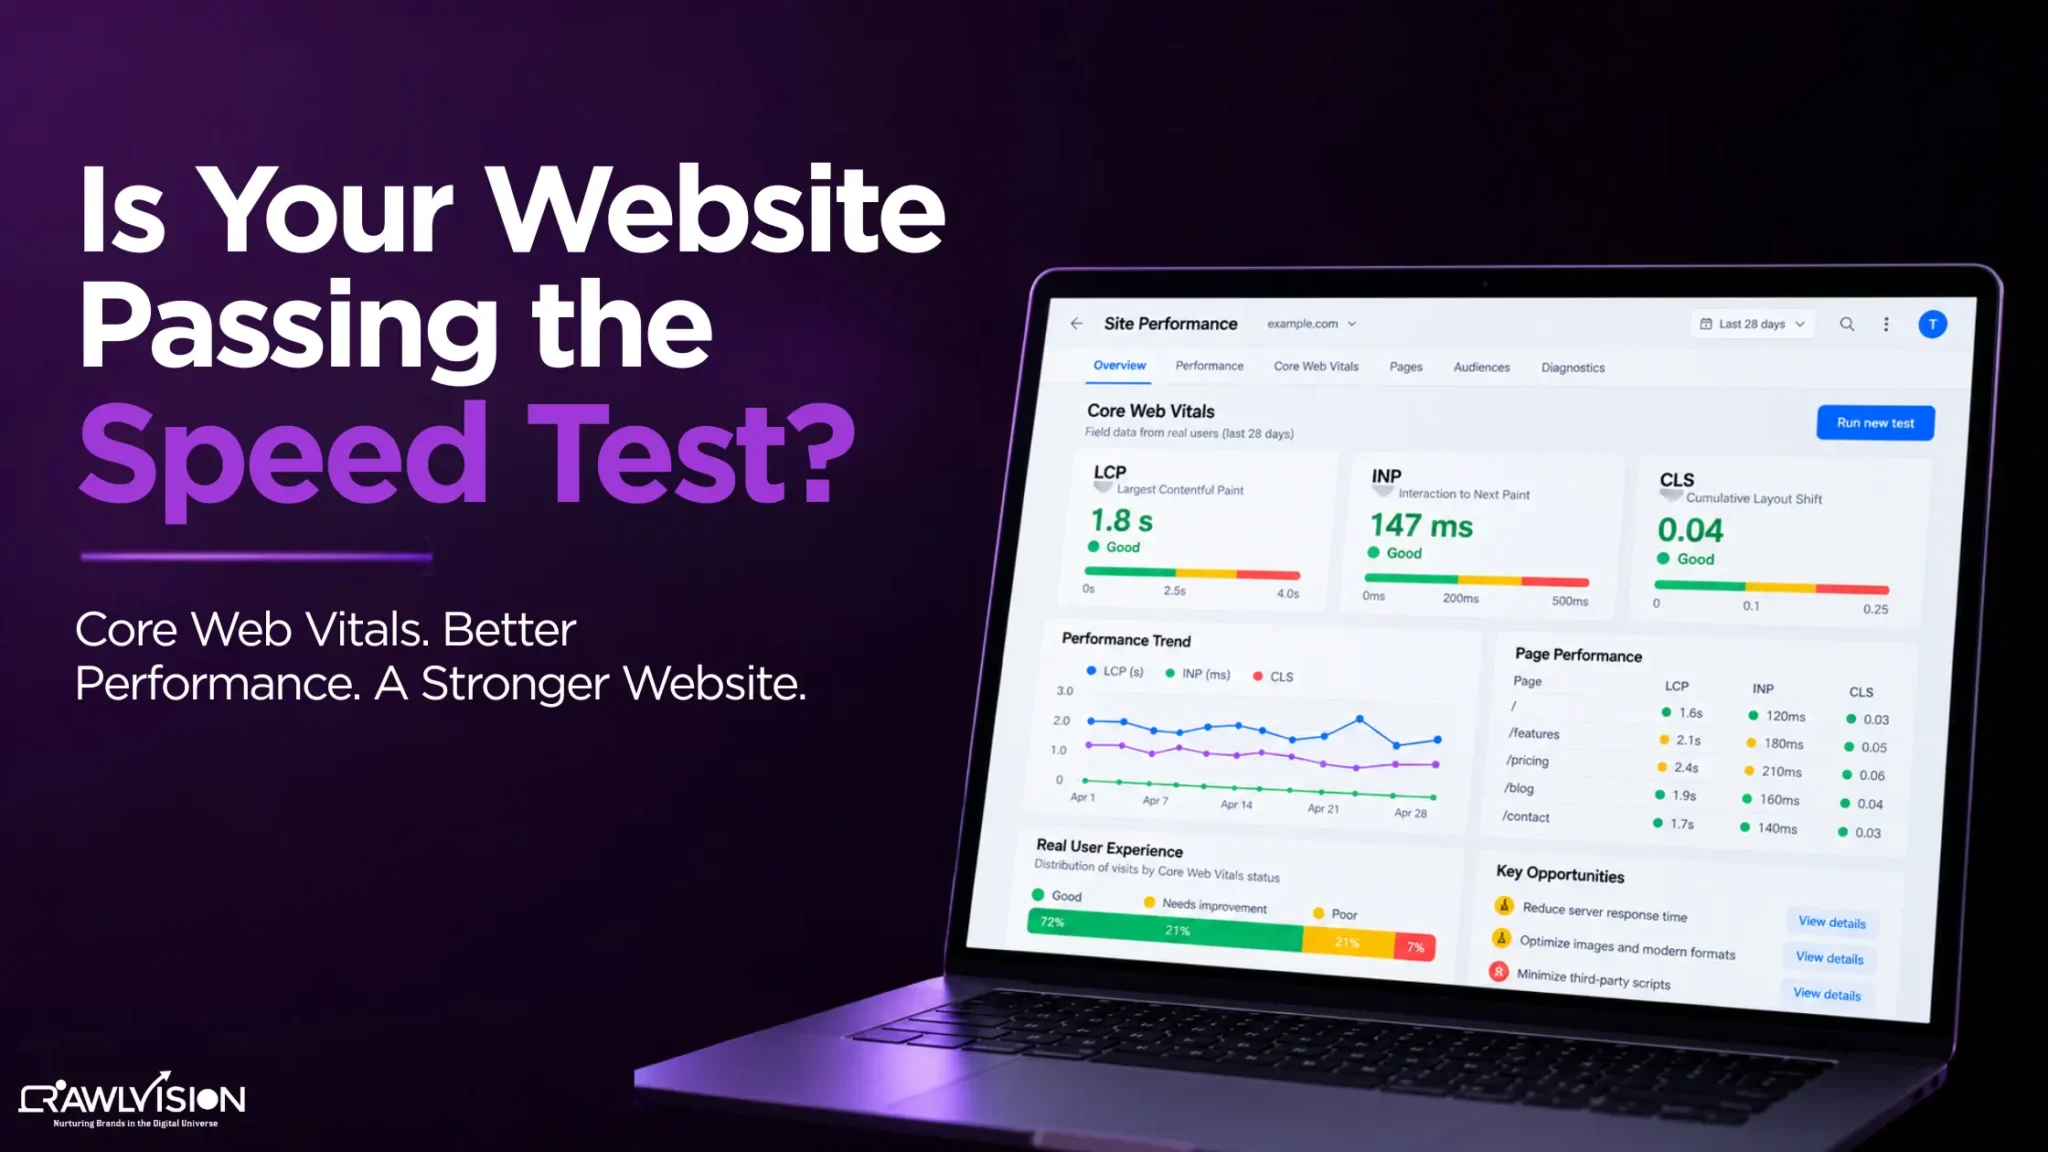
You can check Core Web Vitals using Google Search Console and PageSpeed Insights. Use Search Console to identify affected URL groups, then use PageSpeed Insights to investigate individual pages and understand which metrics need improvement.
What Are Core Web Vitals?
Core Web Vitals are three Google metrics that measure loading performance, interactivity, and visual stability: LCP, INP, and CLS. Google recommends evaluating them at the 75th percentile of page visits, separately for mobile and desktop.
1. Lcp
Largest Contentful Paint (LCP) measures how quickly the main content of a page becomes visible. A good LCP is 2.5 seconds or less.
2. Inp
Interaction to Next Paint (INP) measures how responsive a page is when users interact with it. An INP of 200 milliseconds or less is considered good.
3. Cls
Cumulative Layout Shift (CLS) measures unexpected movement of page content while it loads. A CLS of 0.1 or less is considered good.
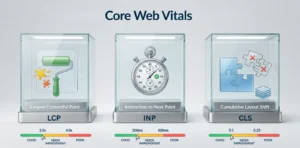
Core Web Vitals Thresholds
The current Core Web Vitals thresholds show whether each metric falls within the Good range.
| Metric | What It Measures | Good |
| LCP | Loading performance | ≤ 2.5 seconds |
| INP | Interaction responsiveness | ≤ 200 ms |
| CLS | Visual stability | ≤ 0.1 |
These thresholds are applied to the 75th percentile of field data. A Core Web Vitals assessment passes when the relevant available metrics meet the Good threshold at that percentile.
How to Check Core Web Vitals in Google Search Console
Google Search Console is useful for finding Core Web Vitals problems across groups of URLs because its report uses real-user data and groups pages with similar experiences.
- Open Google Search Console.
- Select the relevant property.
- Go to Core Web Vitals under Experience.
- Choose Mobile or Desktop.
- Review URLs grouped as Good, Needs Improvement, or Poor.
- Open an issue to see affected URL examples.
- Investigate those pages individually.
Search Console groups similar URLs and reports issues from field data. If several product pages, blog posts, or service pages share a problem, look for a common template or technical cause instead of treating every URL as a separate issue.
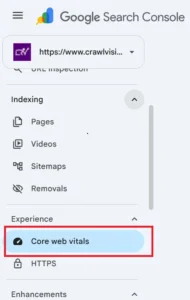 Note: The screenshot shows the Core Web Vitals option inside GSC.
How to Check Core Web Vitals in PageSpeed Insights
PageSpeed Insights lets you test an individual URL and combines real-user field data with controlled Lighthouse lab testing.
- Open PageSpeed Insights.
- Enter a page URL.
- Run the test.
- Review the Core Web Vitals assessment.
- Compare mobile and desktop results.
- Check the diagnostics and opportunities below the metrics.
PageSpeed Insights can show field data from the Chrome User Experience Report (CrUX), when sufficient data exists, alongside Lighthouse diagnostics. Its field data represents a trailing 28-day period, while lab data comes from a controlled test.
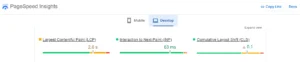 Note: The screenshot shows real LCP, INP, and CLS data for the Crawl Vision page.
Field Data vs Lab Data
Field data shows how real users experienced a page across different devices and network conditions. Lab data tests the page under controlled conditions, making it useful for reproducing and investigating performance issues.
Both types of data are useful when checking Core Web Vitals.
How to Check Core Web Vitals in 6 Easy Steps
Step 1: Start with Google Search Console
Find URL groups with Poor or Needs Improvement issues.
Step 2: Pick an affected URL
Choose a representative page from the affected group.
Step 3: Test the URL in PageSpeed Insights
Review LCP, INP, and CLS and note whether field data is available.
Step 4: Check field data
Use real-user measurements to understand performance outside a controlled test.
Step 5: Review diagnostics
Look for possible causes such as render-blocking resources, large images, heavy JavaScript, or layout shifts.
Step 6: Fix and retest
After making changes, test the page again and monitor field data over time.
What Do Core Web Vitals Scores Mean?
Core Web Vitals statuses show whether a metric falls within Google’s Good, Needs Improvement, or Poor ranges.
| Status | What It Means |
| Good | The metric meets the recommended threshold. |
| Needs Improvement | The metric is above Good but below the Poor range. |
| Poor | The metric exceeds the Poor threshold. |
For example, an LCP of 2.3 seconds is Good, while 3.2 seconds is Needs Improvement. The same principle applies to INP and CLS using their respective thresholds.
How to Check Each Core Web Vital: LCP, INP, and CLS
You can check each Core Web Vital in PageSpeed Insights by reviewing field data for the tested URL and then using lab diagnostics to investigate possible causes.
1. How to Check LCP
Large hero images, slow server responses, and delayed rendering are useful starting points when investigating an LCP above 2.5 seconds.
2. How to Check INP
Heavy JavaScript, long-running tasks, and inefficient event handling can delay the browser’s response to clicks, taps, or other interactions.
3. How to Check CLS
Look for images or videos without defined dimensions, dynamically inserted elements, ads, embeds, or fonts that cause visible content to move.
What to Do If Your Core Web Vitals Are Poor
If Core Web Vitals are poor, identify the affected metric first, then investigate the technical causes behind it rather than trying to improve one overall score.
- High LCP? Investigate server response time, images, critical resources, and rendering.
- Poor INP? Look at JavaScript execution, long tasks, and interaction handlers.
- High CLS? Check image dimensions, dynamically loaded elements, fonts, ads, and embeds.
Core Web Vitals can also be reviewed as part of a wider technical SEO audit. When performance issues appear alongside crawling, indexing, or other technical problems, a broader audit helps connect those issues instead of treating them in isolation.
In website audits at Crawl Vision, we often find Core Web Vitals issues affecting groups of pages rather than one URL. This usually points to a shared template, image setup, JavaScript, or third-party script that needs fixing at the source.
Conclusion
Checking Core Web Vitals is not just about running a website speed test. It starts with Google Search Console to identify URL groups with performance issues, followed by PageSpeed Insights to examine individual pages and understand what is causing poor LCP, INP, or CLS.
Use field data to understand real-user performance, lab diagnostics to investigate technical causes, and monitor the affected pages after making improvements.
Identify underlying issues affecting loading, responsiveness, and visual stability, fix them at the source, and continue monitoring Core Web Vitals as your website changes.