

Google Analytics has introduced customizable Dashboards (announced September 9, 2026), giving marketers a new way to organize and monitor important website metrics in one place.
The new feature lets users create reporting views using different metrics, dimensions, and visualizations. It also adds a drag-and-drop interface for arranging dashboard cards.
The update is designed to make Analytics reporting more flexible without requiring marketers to move between multiple reports.
What Google Analytics Reporting Looked Like Before
Before the new Dashboards experience, marketers primarily relied on Google Analytics’ existing reports and collections to monitor website performance.
These reports provide access to a wide range of data, but teams often need to move between different reports to review specific metrics.
For SEO teams, this can mean checking organic traffic, landing-page performance, engagement, and conversions across different areas of Analytics.
Before the Dashboards update:
(Predefined reporting view)
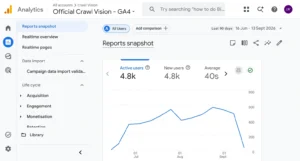
Note: Screenshot taken by the Crawl Vision team.
What’s New in Google Analytics Dashboards
The new Dashboards feature lets users bring different data points into a single customizable reporting view.
Users can add cards, move them around the dashboard, resize them, and organize them according to their reporting needs.
Google currently supports several visualization types, including:
- Scorecards for tracking key KPIs
- Tables for detailed data
- Line charts for monitoring trends
- Bar charts for comparing values
- Donut charts for viewing data breakdowns
- Funnel charts for analyzing conversion steps
Users can also apply date comparisons to scorecards and view line-chart data across daily, weekly, or monthly periods.
After the Dashboards update:
(Customizable reporting view)
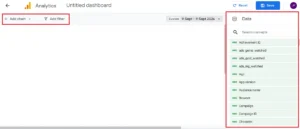
Note: Screenshot taken by the Crawl Vision team.
How Does the New Customizable Dashboard Work?
Users can build a dashboard by adding the metrics and dimensions they want to monitor.
The dashboard uses a grid-based layout where cards can be moved, resized, and arranged into a custom reporting view.
Once a dashboard is ready, users can publish it to the Reports navigation so people with access to the Analytics property can view it.
Google Analytics supports up to 15 cards per dashboard for standard properties and up to 30 cards for Google Analytics 360 properties.
Where to Find the New Customizable Dashboards in GA4
- Sign in to Google Analytics and select the relevant GA4 property.
- In the left navigation, go to Reports.
- Click the large Create (+) button shown above “Report Snapshot”
- From the options that appear, choose Dashboard.
- Now you are ready to use the new customizable dashboard feature, where you can:
-
- Add cards with metrics and dimensions
- Drag, drop, and resize cards
- Save and publish the dashboard, so it appears under Reports for users with access
Note: If you don’t see the Dashboard option yet, it may still be rolling out to your property.
Why Is Google Adding Customizable Dashboards?
The new feature gives marketers more control over how they view Analytics data.
Different teams monitor different performance indicators. SEO teams may focus on organic traffic and conversions, while ecommerce teams may need revenue, purchases, and product performance.
Customizable Dashboards allow each team to bring its most important metrics into a single reporting view.
This can make routine performance monitoring easier and reduce the need to navigate through multiple reports.
What Does This Mean for SEO?
The new Dashboards do not change Google rankings or introduce a new SEO ranking factor.
Instead, they give SEO teams a more flexible way to monitor organic search performance.
An SEO dashboard could combine organic traffic, landing-page performance, conversions, and engagement in one place.
This can make it easier to identify changes in organic performance and connect search traffic with actual website outcomes.
For agencies, customized dashboards could also simplify recurring SEO reporting across different clients and campaigns.
Should Marketers Change Their GA4 Setup?
No immediate change is required.
The new Dashboards are an additional reporting option, so marketers can continue using their existing GA4 reports and collections.
Teams that regularly monitor the same KPIs can create a dashboard around those metrics instead.
For SEO teams, this could include organic traffic, top landing pages, conversions, and other metrics used in regular performance reviews.
The Bigger Marketing Takeaway
Google Analytics is giving marketers more control over how they organize and view website data.
The new customizable Dashboards do not change how Google evaluates websites in Search. They change how marketers can monitor the results of their SEO and marketing efforts.
For SEO teams, the practical takeaway is simple: use Dashboards to bring the metrics that drive decisions into one view, rather than tracking every metric available in GA4.